Why Inserts Slow Down Milvus Search, and Why More Nodes May Not Help
In Milvus 2.5, the write stream feeds the query layer too. A bulk insert can push up search latency with flat search traffic, and the obvious fixes (more DataNodes, more replicas, weaker consistency) often miss. Here is the mechanism and what actually works.

A common scenario: a nightly job re-embeds a large slice of the corpus and bulk-loads it into Milvus. Search traffic is the same as every night, but search p99 doubles, some queries time out, and eventually the loader starts getting rejections. The QueryNode dashboard shows memory climbing although nobody is searching more.
The natural reactions are to add DataNodes because "it's an ingestion problem", add replicas because "search is slow", or drop to eventual consistency. Each can miss, and some make it worse. The reason is one detail of the Milvus 2.5 architecture: the write stream feeds the query layer too.
One stream, two consumers
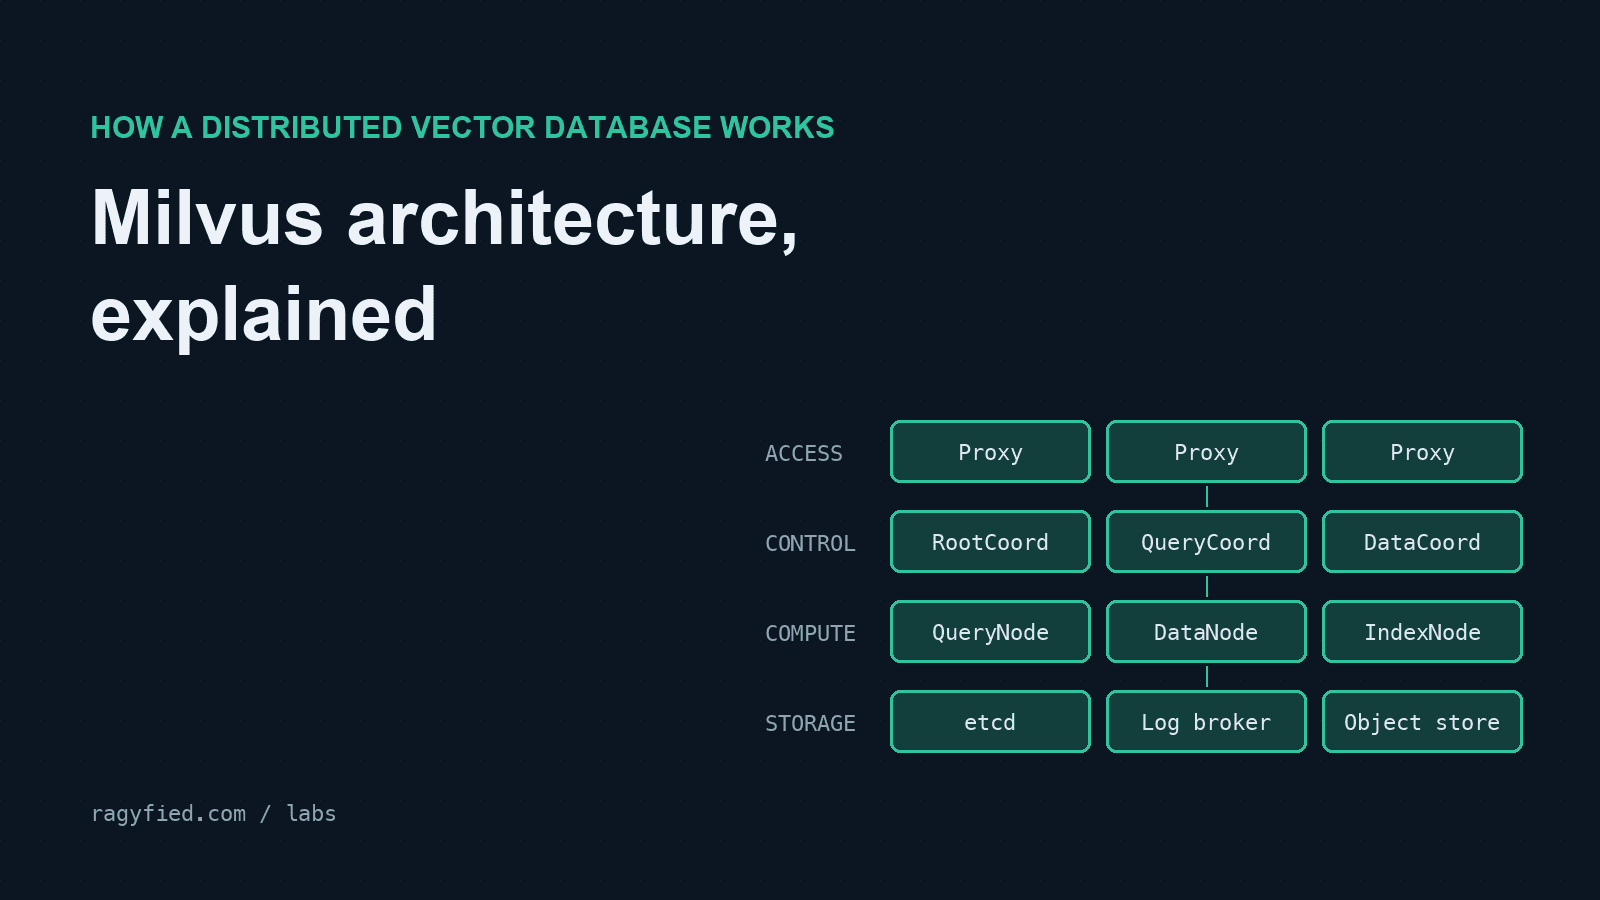
When a Proxy accepts an insert, it publishes the rows to the shard's channel in the log broker (Kafka or Pulsar). Two different workers consume that channel, independently:
- DataNodes buffer the rows and flush them to object storage as segment files. That is the persistence path.
- QueryNodes add the rows to an in-memory growing segment, so the data is searchable before it is sealed and indexed. That is the freshness path.
So every insert is work for QueryNodes: applying mutations, holding growing data in memory, and in 2.5 possibly building an interim index for it. On the query side, a bulk load looks like extra memory and CPU pressure on exactly the nodes that serve searches.
You can watch the two consumers diverge in the animated insert flow.
Three ways it hurts search
1. Resource contention. Growing segments consume memory, and applying mutations consumes CPU that searches need. Channel ownership is per QueryNode, so if a few channels are hot, a few nodes take most of the load while fleet averages look fine.
2. Waiting for freshness. Every search has a consistency level. With Strong consistency, a QueryNode must have consumed the stream up to the search's timestamp before it executes. If the node is behind on a burst, the search waits. Latency rises without any extra vector math, and it looks exactly like "slow search" on a dashboard.
3. Backpressure. When QueryNode or DataNode memory crosses configured watermarks, or internal progress (time-tick delay) falls too far behind, Milvus reduces or rejects writes. That is the rejection the loader sees. It is protection working as designed.
Why the obvious fixes miss
Fix | What actually happens |
|---|---|
Add DataNodes | Persistence gets faster. QueryNodes, which hold the growing data and serve searches, are unchanged. |
Add collection replicas | Each replica is another full copy that also consumes the stream. Memory demand and broker egress go up. |
Add QueryNodes | Helps only if the work can move. One hot channel stays on one node. |
Switch to eventual consistency | Searches stop waiting but return older results. The ingestion bottleneck is still there. |
Raise watermarks or disable protection | Controlled rejections become out-of-memory crashes, which are far harder to recover from. |
Longer timeouts and more retries | Waiting work piles up, and retries add load to the busiest path. |
How to diagnose it
Put ingestion and search on one timeline:
- Insert rate (rows and bytes) per collection.
- Consumer lag for DataNodes and QueryNodes separately. Diverging lag shows which path is behind.
- Per-QueryNode memory, CPU, growing-segment size and channel ownership. Look at the busiest node, not the average.
- Search time split into waiting and execution. Waiting points to freshness; execution points to compute.
- The actual rejection reason on failed inserts: memory protection, time-tick delay or a rate quota.
If QueryNode lag and memory climb with the insert rate while search QPS is flat, you have this pattern.
What works
Stabilize first. Slow or pause the bulk load. Keep protections on. Let lag drain and memory recover.
Shape the load. Rate-limit bulk ingestion with explicit Milvus DML limits (quotaAndLimits.dml.insertRate.*, measured in MB/s, not rows/s), or throttle it in the loader. Schedule large backfills for low-traffic windows.
Budget QueryNodes for ingestion. Size query memory for loaded data plus growing data at peak insert rate, plus recovery headroom. The vector database sizing calculator holds back 25–30% of each node's memory for this.
Fix hot channels before adding nodes. Check which QueryNodes own the growing data. Collection shard count is set at creation, so plan it for your peak ingestion.
Ramp back gradually. Recovery is done when lag is back to normal, memory has headroom and real insert and search probes meet their targets, not when the pods are Running.
A related trap: the hot Proxy
The same "average looks fine" symptom appears at the access layer. gRPC sends many requests over one long-lived HTTP/2 connection, and a Layer 4 load balancer only chooses a backend per connection. A few heavy clients can pin their traffic to one or two Proxies while the rest idle. Compare the busiest Proxy with the fleet, and use request-aware (Layer 7) or client-side balancing. Expect that fixing it admits more writes into the broker and QueryNodes, so the bottleneck may move downstream.
The lessons
- In Milvus 2.5, inserts are a query-layer workload. Budget QueryNode memory and CPU for them.
- Slow search can be waiting for freshness, not computing. Measure the two separately.
- Backpressure is a symptom. Reduce the offered load instead of silencing it.
- "Add more workers" moves pressure around. Name the constrained resource before scaling anything.
These patterns, plus broker throttling and metadata growth, are traced step by step in the Milvus incident patterns lab.